Key Features
Intuitive and easy-to-use interface
JustTLC is built around a simple principle - Ease-of-use and straightforward analysis
flow.
JustTLC is therefore divided into four distinct views:
 Start Page
- This view lists your recently opened projects, contains a getting started panel
and a short introduction to JustTLC. Start Page
- This view lists your recently opened projects, contains a getting started panel
and a short introduction to JustTLC.
|
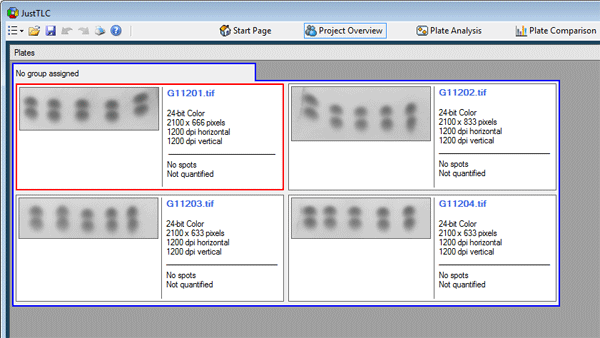
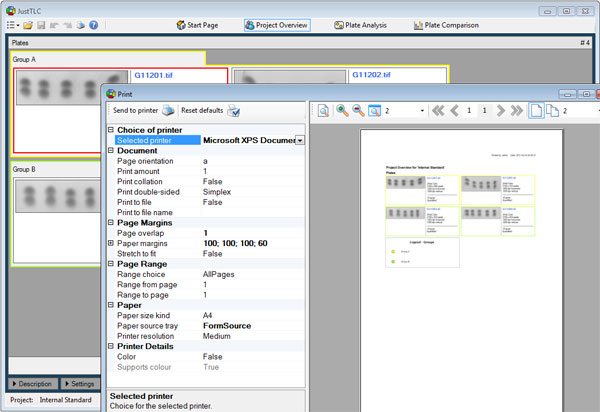
 Project
Overview - This view gives you a complete overview of your project. Navigate
between all the images in your project and watch the project description and settings. Project
Overview - This view gives you a complete overview of your project. Navigate
between all the images in your project and watch the project description and settings.
|
 Plate
Analysis - This view displays on one image at a time and lets you perform
tasks such as spot detection and quantification. Plate
Analysis - This view displays on one image at a time and lets you perform
tasks such as spot detection and quantification.
|
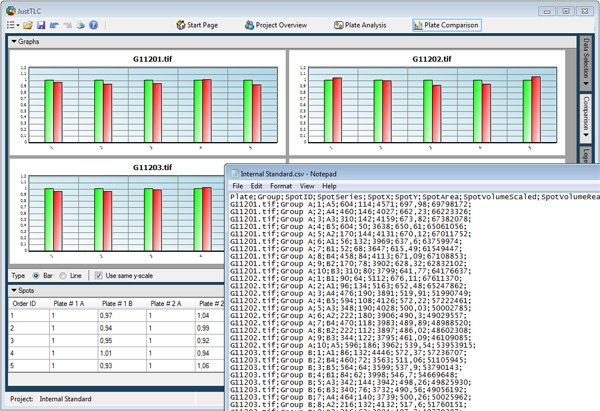
 Plate
Comparison - This view displays analysis data in a comprehensive and comparable
way. View several graphs next to each other either as bar or line graphs or probe
into the details using the data tables. Plate
Comparison - This view displays analysis data in a comprehensive and comparable
way. View several graphs next to each other either as bar or line graphs or probe
into the details using the data tables.
|
Enjoy top notch user interface design fused with reliable data analysis algorithms.
Multiple image format support
JustTLC supports major image formats listed below:
The supported bit depths are 8 and 16-bit grayscale, 24, 32, 48 and 64-bit color.
Thus, medical image bit depth is supported giving you the highest possible dynamic
range on your data.
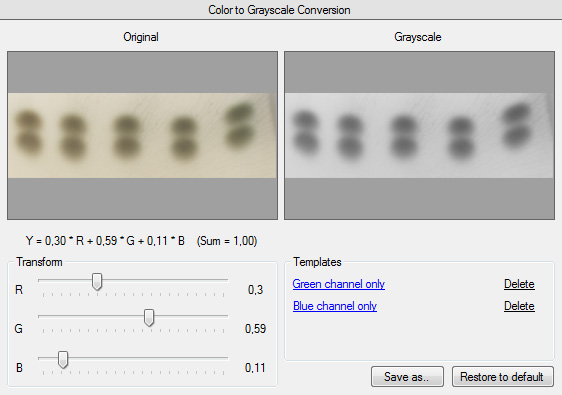
Converet color images to grayscale monochrome images on the fly. Use a standard
grayscale transform or define your own.
Several images in one project
In JustTLC it is a simple task to select desired images and place them in a project.
You can add or delete images from existing projects at any time making it easy to
explore new ideas along the way.
Automatic spot detection and quantification
By following a three step work flow you can automatically detect and quantify spots
in your images. All it takes is moving one slider, selecting number of desired spots
and clicking on two buttons.
Simple yet powerful editing
|
Editing imaging analysis results can be a tedious task. This is not the case in
JustTLC. We have made the editing a pure pleasure. Simply select your desired pointer
tool and start editing.
Add/remove spots by using the spot editing tool ( ). ).
Edit spot contours using either an ellipse or free hand ( ). It is your choice, which ever suits you the best. ). It is your choice, which ever suits you the best.
Clone spots or define custom background regions using the spot clone tool ( ). Simply drag an existing spot to a new location. ). Simply drag an existing spot to a new location.
|
|
Grouping for increased statistical reliability
In JustTLC you can arrange images in groups and order them within each group. This
is a convenient way of organizing your data.
With a few simple clicks the images are grouped and you can compare replicates.
As a result the statistical reliability in your experiment significantly increases.
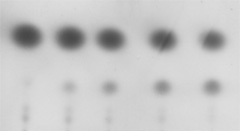
Cross comparison between images
JustTLC contains powerful mechanisms for comparing data between several different
images. This is achieved by normalizing the data before comparing.
In order to improve the comparison it is necessary to remove technical differences
between plates such as staining, scanning and sample volume variations. The spot
normalization may be altered in no less than four different ways.
|
|
|
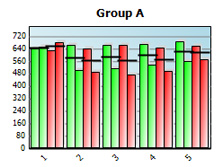
Before normalization
|
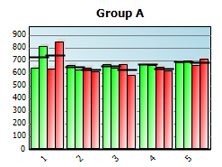
After spot series normalization
|
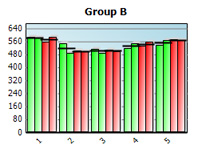
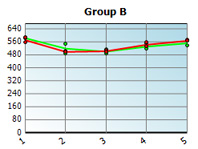
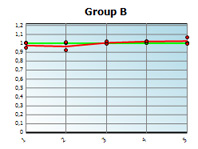
Customizable graphs and data tables
JustTLC includes simple yet powerful graphing capabilities. Analyse complete data
series instantly by looking at the predefined garphs or customizing them in your
own favourite way.
|
|
|
|
Bar graph
|
Line graph
|
Line graph (spot by spot)
|
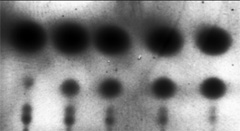
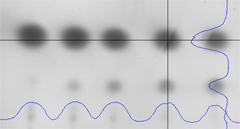
Includes image inspection tools
Easily inspect your images using intensity graphs or contrast enhancement modes.
With these tools you can detect and avoid saturation, heavy background variation
and speckled images.
|
|
|
Top left: Image displayed in default mode.
Top right: Contrast enhanced image to reveal details.
Bottom left: Image with intensity graph overlayed.
|
Extensive export to Excel or CSV files
With a single menu click your whole project is exported to Excel or a comma separated
values (CSV) file. If you only need data from a couple of spots just select, copy
and paste it into desired third party software.
Powerful printing
When you need a paper copy of your project or favourite analysis result, do not
worry. JustTLC includes a powerful printing feature that can be accessed on every
view. Simply configure your current view and send it to the printer.
Aids compliance with FDA 21 CFR part 11
Below you will find our compliance matrix.
|
Subpart
|
Subject
|
Compliance
|
|
§11.10 (a)
|
Validation of software
|
X
|
|
§11.10 (b)
|
Accurate and complete copies of records
|
X
|
|
§11.10 (c)
|
Protection of records
|
X
|
|
§11.10 (d)
|
Limiting system access
|
X
|
|
§11.10 (e)
|
Computer-generated audit trail
|
X
|
|
§11.10 (f)
|
Operational system checks
|
X
|
|
§11.10 (g)
|
Authority checks
|
X
|
|
§11.10 (h)
|
Device checks
|
SOPs
|
|
§11.10 (i)
|
Education and training of personnel
|
SOPs
|
|
§11.10 (j)
|
Personnel accountability
|
SOPs
|
|
§11.10 (j)
|
Control of documentation
|
X
|
|
§11.30
|
Controls for open systems
|
N/A
|
|
§11.50 (a)
|
Electronic signature contents
|
X
|
|
§11.50 (b)
|
Electronic signature controls
|
X
|
|
§11.70
|
Electronic signature linking to records
|
X
|
|
§11.100 (a)
|
Unique electronic signatures
|
X
|
|
§11.100 (b)
|
Identity verification
|
SOPs
|
|
§11.100 (c)
|
Certification of electronic signature use
|
SOPs
|
|
§11.200 (a)
|
Electronic signature components
|
X
|
|
§11.200 (b)
|
Biometric electronic signatures
|
N/A
|
|
§11.300 (a)
|
Unique identifications and passwords
|
X
|
|
§11.300 (b)
|
Password aging
|
X
|
|
§11.300 (c)
|
Loss management
|
SOPs
|
|
§11.300 (d)
|
Transaction safeguards
|
X
|
|
§11.300 (e)
|
Testing of biometric devices
|
N/A
|
X = Compliant when configured according to the JustTLC user guide.
SOPs = Must be handled through company procedures.
N/A = Not addressed.
Any software that is used to comply with 21 CFR Part 11 is only an element of the
solution. Compliance cannot be achieved by the introduction of tools alone. It is
how the tools are used that determines whether or not an organization reaches its
compliance goals.
|